Stock quote
Stock quote
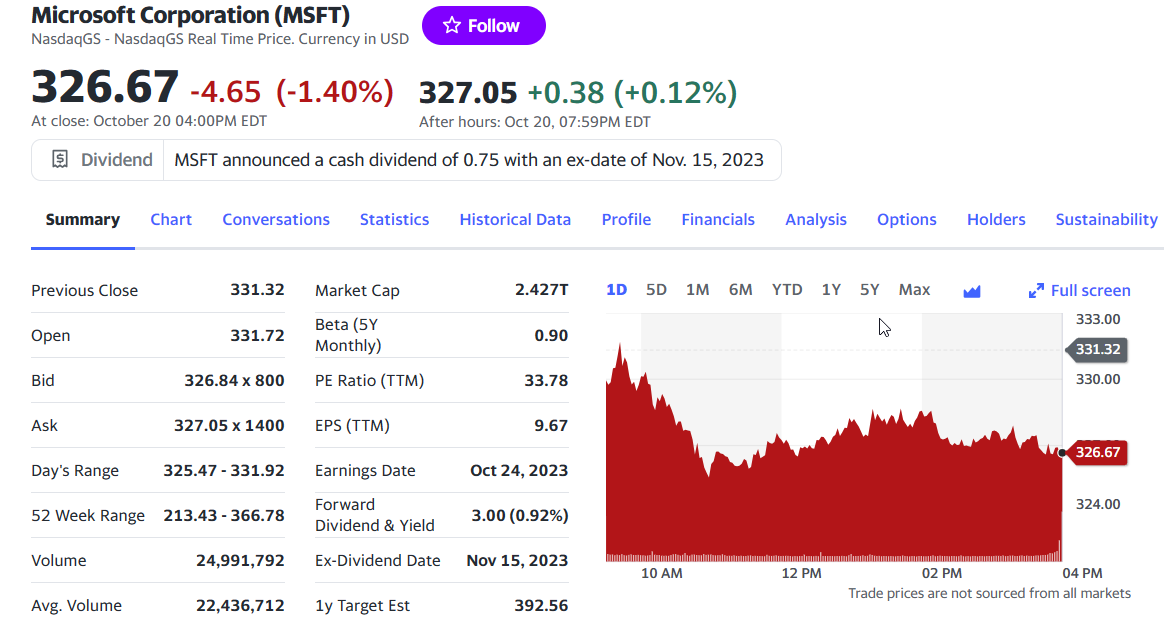
Previous close
It refers to the price at which a stock traded at the end of the previous trading day. This figure is a crucial reference point for investors, helping them assess how the stock has performed in relation to its closing price from the previous day.
Open
Open price refers to the initial price at which a stock starts trading at the beginning of the trading day. This figure is a foundational reference point for the day’s trading activities and influences investor perceptions of the stock’s performance.
Bid
Bid price represents the highest price that potential buyers are willing to offer for a specific stock. This figure provides valuable insights into market sentiment and the current demand for the stock. When you see a bid value like “326.84 x 800,” it’s meant to provide two essential details. The “326.84” represents the highest price potential buyers are willing to pay for the stock, and “x 800” indicates that there are 800 shares or contracts available at this price. This format efficiently conveys both the price and quantity of the bid.
Ask
It signifies the absolute lowest price at which a seller is open to relinquishing their stock. Essentially, the ask is the gateway for potential buyers who are eyeing shares of a specific company. This figure is a pivotal element within a stock quote, offering critical insights into the market dynamics. When you encounter a value like “327.05 x 1400,” it indicates that there are 1,400 shares available for sale, with each share priced at 327.05. This format efficiently conveys both the price and quantity of the ask.
Day’s range
The “day’s range” signifies the price range between the lowest and highest points at which the stock traded during a single trading day. This data is of great significance to investors as it unveils the stock’s intraday price fluctuations, providing essential insights for decision-making regarding buying or selling.
52 week range
The “52-week range” signifies the price range between the lowest and highest values at which the stock has been traded over the past 52 weeks. This data is of utmost importance to investors, offering a comprehensive view of the stock’s performance and trends over a more extended period, aiding in informed decision-making.
Volume
“Volume” signifies the immediate number of transactions occurring for a specific stock. This metric is of paramount importance as it serves as a direct indicator of market interest and the intensity of trading activity centered on that stock, providing crucial insights for investors.
Avg. volume
“Average volume” signifies the standard number of daily transactions for a specific stock. This metric is of great importance as it provides investors with a clear understanding of the typical level of trading activity associated with that stock, aiding them in making informed decisions.
Market cup
“Market capitalization,” or market cap, signifies the size of a company as perceived by the stock market. This metric is of utmost importance, as it directly reflects the company’s total value in the eyes of investors, providing essential insights for decision-making in the world of finance.
Beta (5Y Monthly)
“Beta (5Y monthly)” stands as a pivotal measure of a stock’s risk:
- A beta value of 1.0 signifies that the stock moves in lockstep with the broader market, mirroring its price movements.
- If the beta exceeds 1.0, it indicates that the stock swings more dramatically in price than the market, underscoring its higher volatility.
- Conversely, a beta below 1.0 signals that the stock experiences less turbulent price movements than the market.
Understanding beta provides investors with critical insights into a stock’s risk profile and how it behaves relative to the broader market.
PE Ratio (TTM)
The PE ratio (TTM) emerges as a pivotal financial metric. Representing the Price to Earnings ratio over the trailing twelve months, it delves into the correlation between a company’s stock price and its earnings per share during the past year. This ratio serves as a potent gauge, helping investors determine whether a stock is perceived as overvalued or undervalued by the market. Understanding the PE ratio (TTM) is essential for assessing a company’s valuation and making informed investment decisions.
EPS (TTM)
EPS (TTM) takes center stage as a vital financial metric. Representing Earnings Per Share on a trailing twelve-month basis, it unveils the earnings portion allocated to each outstanding share of common stock over the past year. For investors, this metric is of utmost importance, providing valuable insights into a company’s profitability on a per-share basis. Understanding EPS (TTM) is essential for evaluating a company’s financial performance and making informed investment decisions.
Earning Date
The earnings date is a significant event. It designates the scheduled reporting date for a company’s financial results, unveiling essential insights into how the company is performing. Investors eagerly await this event to gauge the company’s revenue, profit, and various financial metrics, making it a crucial moment in the world of finance.
Forward Divident & Yield
“Forward dividend & yield” stands as a pivotal metric. It uncovers how much a company pays per share as a dividend, providing valuable insights into the company’s dividend policy and what shareholders can anticipate in terms of dividend income. Understanding forward dividend & yield is essential for investors looking to assess potential income from their investments.
Ex-Divident Date
“Ex-Dividend Date” denotes when the company will distribute the next dividend to eligible shareholders. Understanding this date is essential for investors looking to manage their dividend income and make informed investment decisions.
1y Target Est
“1y Target Est” is a pivotal metric. It abbreviates the one-year target estimate, encapsulating the expected price of a stock one year from now as projected by financial analysts. This metric provides investors with valuable insights into the market’s collective forecast of the stock’s future worth, aiding them in making informed investment decisions.