What is eval-cli?
Cross-platform AI evaluation CLI — a single tool that any team can use to evaluate LLM responses, regardless of their language stack.
- Runs quality evaluators: Relevance, Coherence, Fluency, Groundedness, Completeness, Equivalence
- Zero runtime dependencies — self-contained native binary or dotnet tool
- Works with Azure OpenAI and any OpenAI-compatible endpoint (DeepSeek, OpenCode, etc.)
- No code required — pipe JSON in, get scores out
- Standardized evaluators and caching across teams
Notes: Microsoft’s AI evaluation story is split: .NET library vs. Python cloud service, no cross-language CLI. eval-cli wraps the .NET evaluation library into a single binary that any language can call via subprocess or stdin pipe — no per-ecosystem packages needed. Six quality evaluators cover relevance, coherence, fluency, groundedness, completeness, and equivalence. Zero dependencies — self-contained native binary or dotnet tool.
Single Scenario Evaluation
Evaluate individual LLM responses against quality metrics.
eval-cli \
  --endpoint "https://opencode.ai/zen/go/v1" \
  --model "deepseek-v4-pro" \
  --api-key "$API_KEY" \
  --input integration/scenarios.json \
  --evaluators relevance,coherence,fluency \
  --parallel 3
Notes: You feed it a JSON array of scenarios — each with a user query and the LLM’s response. The tool never calls the model-under-test; it only evaluates pre-existing output. The
--parallel 3flag runs three evaluators concurrently. Zero config beyond endpoint + model + input file.
Single Scenario — Output
presentation-single — 5 scenarios, 5 groups

demo.knowledge.earth-moon (n=1)
  ✅ Relevance: 4.00
  ❌ Fluency: 3.00
  ✅ Coherence: 4.00

demo.reasoning.water-states (n=1)
  ✅ Relevance: 5.00
  ✅ Coherence: 4.00
  ❌ Fluency: 3.00

...
Notes: Each line shows ✅ pass or ❌ fail with the numeric score. Fluency scores 0 for the math answer “136” — not wrong, just no grammar to judge. Coherence and relevance are the metrics to watch most for response quality. Five scenarios run in about 15–20 seconds. The output header shows total scenarios and groups — each unique scenario name is its own group.
Multi-Run Aggregation
Same prompt, different output from the system under test each time — LLMs are non-deterministic. Run multiple iterations to see the variance.
eval-cli \
  --endpoint "https://opencode.ai/zen/go/v1" \
  --model "deepseek-v4-pro" \
  --api-key "$API_KEY" \
  --input integration/multi-run-scenarios.json \
  --evaluators relevance,coherence \
  --parallel 3
Notes: When you run the same scenario multiple times, eval-cli groups them by name and computes mean, standard deviation, min, max, and failed fraction per metric. This is why naming matters — same name = same group, different names = separate groups. No separate aggregation step or script needed.
Multi-Run — Output
presentation-multi — 5 scenarios, 2 groups

qa.water-boil (n=3)
  ✅ Coherence: 4.00 ± 0.00  [4.00–4.00]
  ✅ Relevance: 4.33 ± 0.58  [4.00–5.00]

qa.moon-distance (n=2)
  ✅ Relevance: 4.00 ± 0.00  [4.00–4.00]
  ✅ Coherence: 4.00 ± 0.00  [4.00–4.00]
Notes: The output shows mean ± std dev and the [min–max] range per metric. Coherence at 4.00 ± 0.00 means the model was perfectly consistent across all three runs. Relevance at 4.33 ± 0.58 means it varied between 4.00 and 5.00 — still good but less predictable. Std dev tells you about reliability, not just average quality.
What the Stats Tell You
| Pattern | Meaning |
|---|---|
| High mean, low std dev | Consistently good |
| High mean, high std dev | Usually good, occasionally bad — flaky |
| Low mean, low std dev | Consistently bad — prompt is a weakness |
| Low mean, high std dev | Inconsistent — sometimes ok, mostly not |
Std dev is arguably more important than mean. A model with 4.0 ± 0.2 is more reliable than one with 4.5 ± 1.5.
Notes: This table is the takeaway to share with your team. High mean + low std dev = ship it with confidence. High mean + high std dev = flaky, investigate why. Low mean + low std dev = the prompt itself is weak, rework it. Low mean + high std dev = the worst case, probably need a different model or approach. Std dev is your reliability metric — a 4.0 with no variance beats a 4.5 that randomly drops to 1.0.
Results Folder — What’s on Disk
Every run persists results automatically. No flag needed.
eval-results/
  cache/                              ← response cache
  results/
    presentation-multi/               ← library-native format
      qa.moon-distance/
        1.json
        2.json
      qa.water-boil/
        1.json
        2.json
        3.json
  stats/
    presentation-multi/               ← aggregated stats
      qa.moon-distance/
        _stats.json     ← mean, std dev, min, max
      qa.water-boil/
        _stats.json
Notes: Every run persists automatically — no flag, no config. The
results/folder contains library-native ScenarioRunResult JSON files, one per iteration. Thestats/folder is added by eval-cli with_stats.jsonfiles: mean, stdDev, min, max, and failedFraction per metric. The folder is self-contained — copy it to another machine andaieval reportworks. The cache folder stores LLM judge responses so re-runs with identical inputs skip the API call entirely.
Rich HTML Reports via aieval
eval-cli writes in the library’s native format. Use the official aieval CLI to generate interactive HTML reports — no extra export step needed.
dotnet aieval report -p ./eval-results -o report.html --open
Interactive HTML with per-metric scores, ratings, and evaluator reasoning. Execution-level grouping — run multiple evaluations with different --name values for trend comparison.
Notes:
aievalis Microsoft’s official reporting CLI — it reads the exact sameeval-results/directory, no export step needed. The HTML report shows per-metric scores with evaluator reasoning, iteration drill-down for multi-run scenarios, and execution-level grouping when you use different--namevalues. Run with--opento auto-open in browser. The two tools are designed to compose: eval-cli writes, aieval reads.
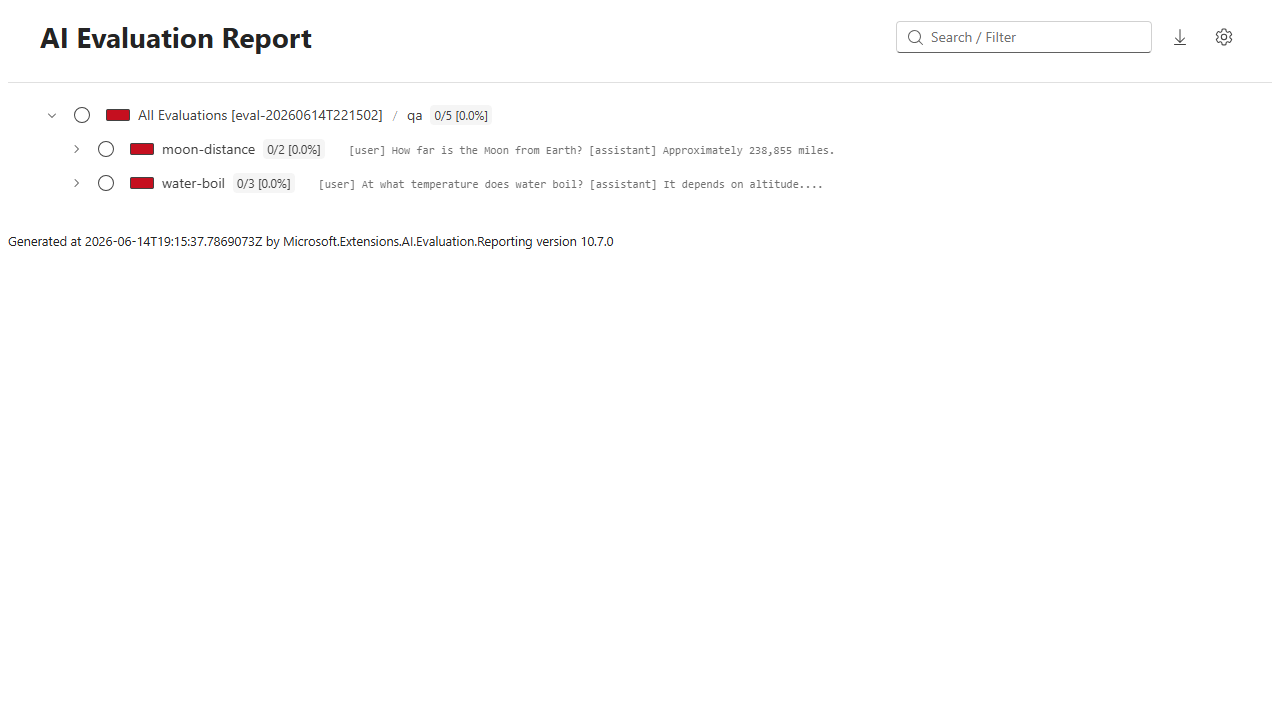
Notes: This is what the output looks like: interactive, filterable HTML with detailed evaluator reasoning for each score. Teams can share the HTML file directly — no server needed, just open in a browser. Each metric gets a rating — Excellent, Good, Fair, or Poor — derived from the numeric score against the configured threshold. Results are grouped by execution name so you can compare runs over time.
Why a CLI, Not a Service
| CLI | REST API Service |
|---|---|
| No operational burden | Auth, availability, rate limiting |
| No CI dependency | Central service = single point of failure |
| Local process = no network latency | HTTP round-trips compound |
| CI runners handle long runs naturally | Timeouts and connection management |
The engine library is separated from the CLI entry point. When centralization becomes necessary, the same EvalEngine.RunAsync() can power an ASP.NET REST API. The CLI is the first delivery vehicle, not the final architecture.
Notes: The key architectural decision: CLI over REST API. Each evaluator call takes 1–5 seconds — over HTTP that compounds with round-trip latency. A local process avoids network overhead entirely. 30 scenarios × 5 evaluators with parallel execution takes 5–8 minutes on typical CI runners — well within build time budgets. No auth to manage, no rate limiting, no availability concerns. The engine library is purposefully separated from the CLI entry point — when centralization becomes necessary, the same
EvalEngine.RunAsync()can power an ASP.NET REST API without rewriting any evaluation logic.